
MaxHydro efficiency definition for each generating unit

Efficiency Matrix
Unit Efficiency is defined in the "Efficiency Matrix Configuration" dialog for a range of Head and Discharge.
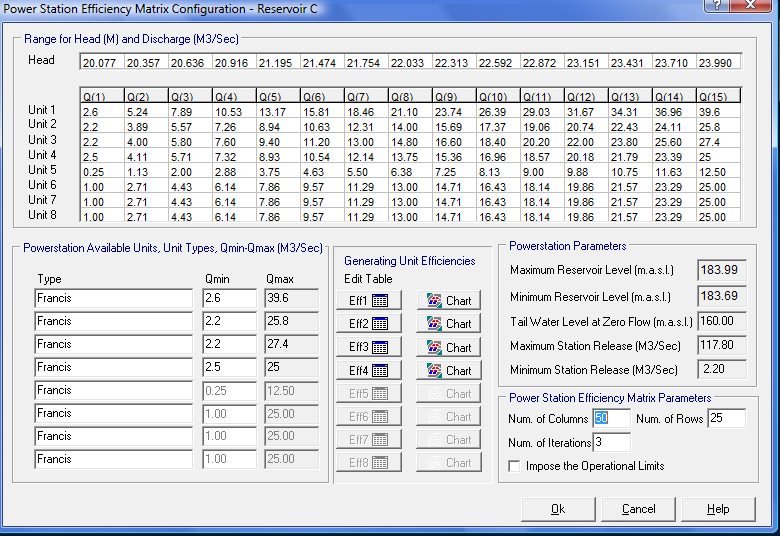
1. Head range: Enter the range of the head from minimum to maximum. The minimum head is defined at minimum reservoir level having maximum station discharge ie. maximum tail water level and maximum of hydraulic losses. The Maximum head is defined at the maximum reservoir level and minimum station discharge with minimum of hydraulic loses.
2. Range for unit discharge is entered for the individual unit (up to 8 units) on the top grid and each row represents the range of unit discharge from minimum to the maximum. There are 15 values to define the discharge at the given head. The minimum value for the discharge range is taken from the Qmin edit box of each generating unit, and the maximum unit discharge is taken from the power station dialog, where the unit maximum discharge has been previously defined.
3. Efficiency: To define the efficiency for each unit click the "Edit Table" button. For example to define the efficiency for 'Unit 1' click on the 'Eff1' button. This will open a dialog with a grid of 15x15 points where to input the efficiency for the selected unit, for each pair of head and unit discharge.
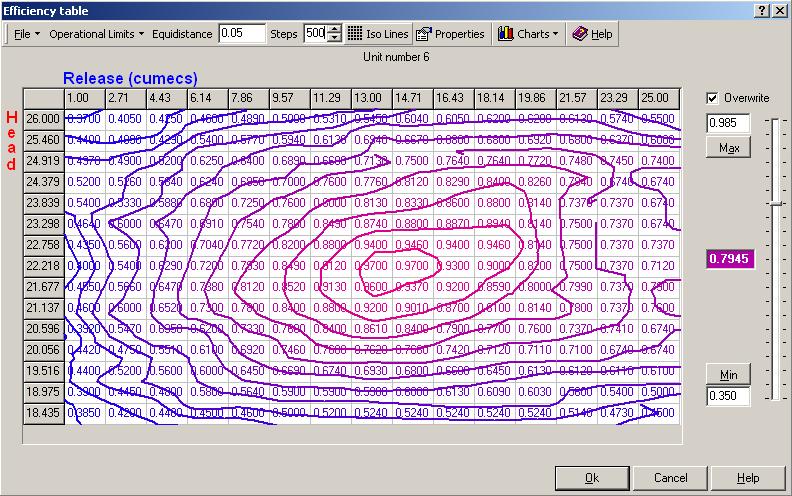
The range for release(discharge) and head defined previously are shown on the horizontal and vertical axis of the above table. Enter the efficiency value for each cell and click the "Iso Lines" button to check the values. To define how many iso lines to draw, set the equidistance between the iso lines - 0.02 should be a good starting value for the equidistance but this can be changed so suit specific cases.
Overwrite: Use this option to speed up the process of entering the data for each cell. Move up or down the slider to find the efficiency value to input and click on the cell in the grid, so that the current value of the cell is overwritten. Change the slider value to the next efficiency value and click to change the value for the cell.
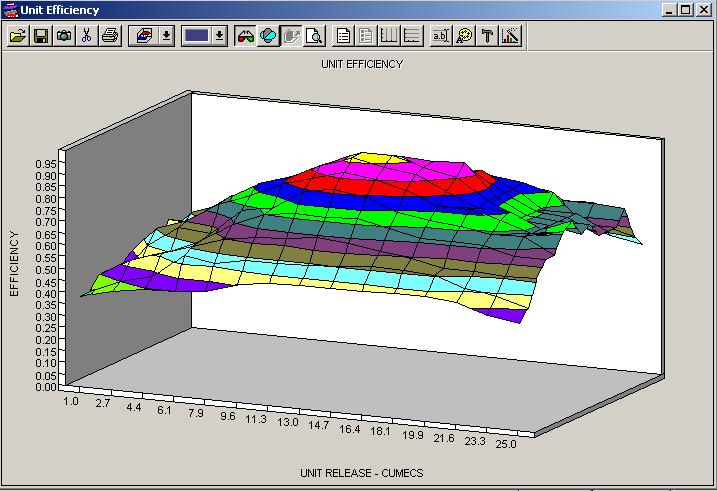
Chart: To see a 3-D graphical representation of the efficiency matrix, select the "Charts/Efficiency Input chart" button from the menu.
Upsize the efficiency table - Properties
Click the "Properties" option from the efficiency table dialog for other options. Using this dialog the efficiency table will be upsized from the original size of 15x15 to a size of 200X200 points without the need to manually input all values in this new table. ALLOCATE uses an interpolation algorithm and the table is automatically created.
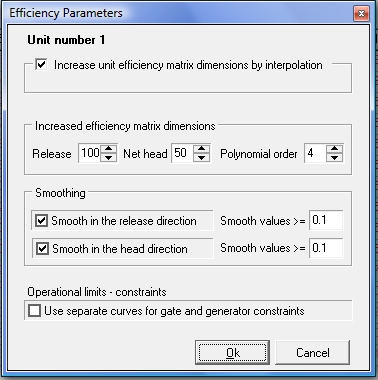
In order to upsize the efficiency table make sure to click the option: "Increase the unit efficiency matrix by interpolation", then select the values for the increased table for the X-axis: Release (discharge) and for the Y-axis: Net head. The order of the polynomial function is entered as a default of 5 -recommended.
Smoothing: Use this function to smooth the peaks in booth directions if needed.
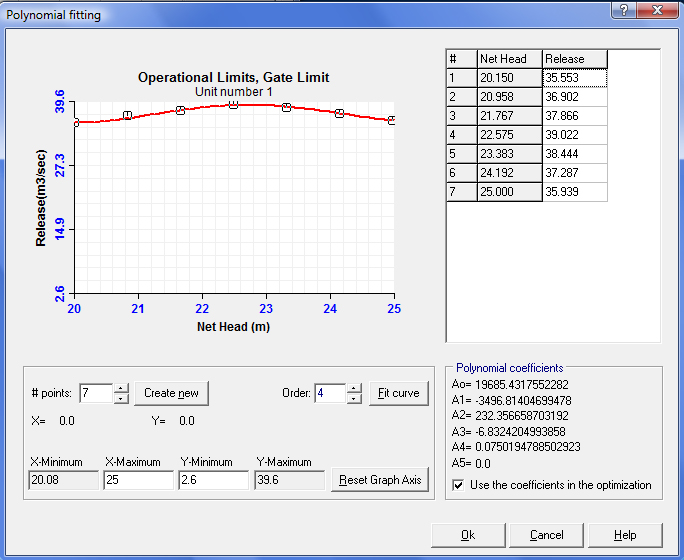
Operational limits-constraints: Tick that option in the above dialog to define operational limits for Gates and Power independent. To define the constraints select the Operational Limits from the Efficiency Table dialog. The following is a sample preview of the operational limits -Gate Limit.
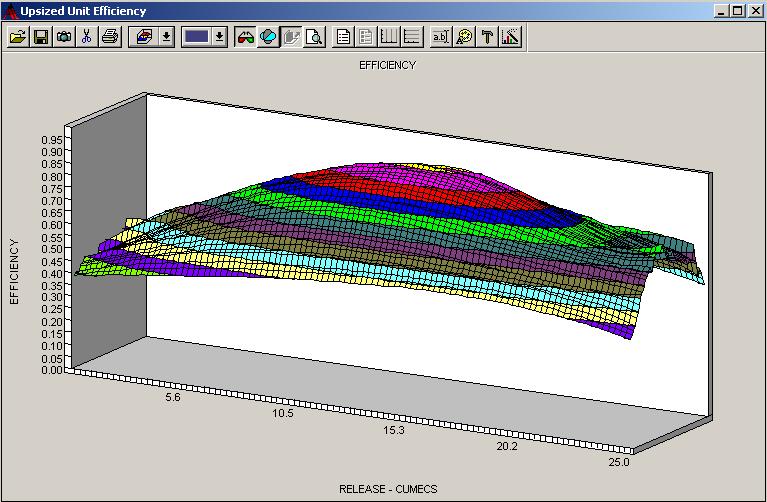
Charts: Use this option to view both the original efficiency matrix and the upsized one - "Interpolated Efficiencies".
The following is a sample preview of a 3-D graph with the upsized unit efficiency:
Copy efficiency values for similar units
Once the first unit efficiency table is completed click Ok to save the results.
To use the efficiency data for another unit select the next unit and click on the "Eff..." button. Select the "File/Copy..." option form the Efficiency Table dialog, the following dialog will be displayed:
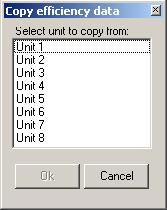
Select the unit to copy the data from and click Ok. The efficiency values will be populated with those of the unit selected. Simply adjust the efficiency values for the new unit.
Alternatively use the "Import Efficiency" option to import the values from a CSV file containing 15x15 cell values for the efficiency table.
At the end after each unit efficiency is defined a combined station efficiency table is generated. This table is generated with a specific module which is part of MaxHydro package. Those efficiency values are for a station discharge and a specific reservoir level and are best or optimal. The MaxHydro optimization module uses these values during the optimization process.


